plydata
plydata is a library that provides a grammar for data manipulation.
The grammar consists of verbs that can be applied to pandas
dataframes or database tables. It is based on the R packages
dplyr, tidyr and forcats. plydata uses the >> operator
as a pipe symbol, alternatively there is the ply(data, *verbs)
function that you can use instead of >>.
At present the only supported data store is the pandas dataframe. We expect to support sqlite and maybe postgresql and mysql.
Example
import numpy as np
import pandas as pd
from plydata import define, query, if_else, ply

# NOTE: query is the equivalent of dplyr's filter but with
#      slightly different python syntax  for the expressions

df = pd.DataFrame({
    'x': [0, 1, 2, 3],
    'y': ['zero', 'one', 'two', 'three']})

df >> define(z='x')
"""
   x      y  z
0  0   zero  0
1  1    one  1
2  2    two  2
3  3  three  3
"""

df >> define(z=if_else('x > 1', 1, 0))
"""
   x      y  z
0  0   zero  0
1  1    one  0
2  2    two  1
3  3  three  1
"""

# You can pass the dataframe as the # first argument
query(df, 'x > 1')  # same as `df >> query('x > 1')`
"""
   x      y
2  2    two
3  3  three
"""

# You can use the ply function instead of the >> operator
ply(df,
    define(z=if_else('x > 1', 1, 0)),
    query('z == 1')
)
"""
    x      y  z
 2  2    two  1
 3  3  three  1
"""
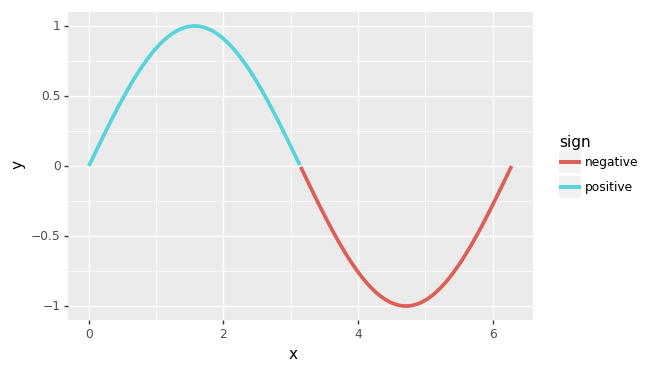
plydata piping works with plotnine.
from plotnine import ggplot, aes, geom_line

df = pd.DataFrame({'x': np.linspace(0, 2*np.pi, 500)})
(df
 >> define(y='np.sin(x)')
 >> define(sign=if_else('y >= 0', '"positive"', '"negative"'))
 >> (ggplot(aes('x', 'y'))
     + geom_line(aes(color='sign'), size=1.5))
 )